Bryant Ackerman
Data Analyst
Data
Analyst


I design automated solutions that eliminate repetitive tasks and accelerate reporting processes.
I build dynamic, interactive dashboards that simplify complex data for business users.
I streamline data workflows to deliver reliable, ready-to-use datasets.
I turn raw data into powerful stories that drive smarter business strategies, using SQL, Power BI, Excel, Python, and more.

Power BI | Excel | DAX
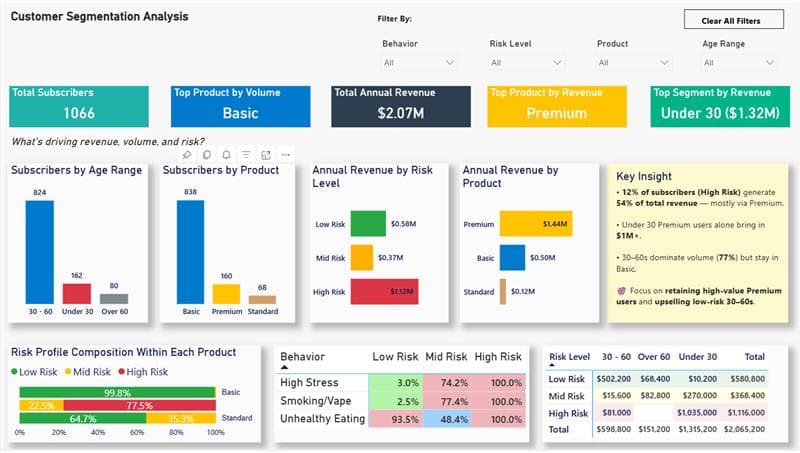
Analyzed revenue and demographics using Power BI, Excel Power Query, and DAX. Targeted insights for product strategy and high-risk segmentation.

Excel | Power Query | Forecasting
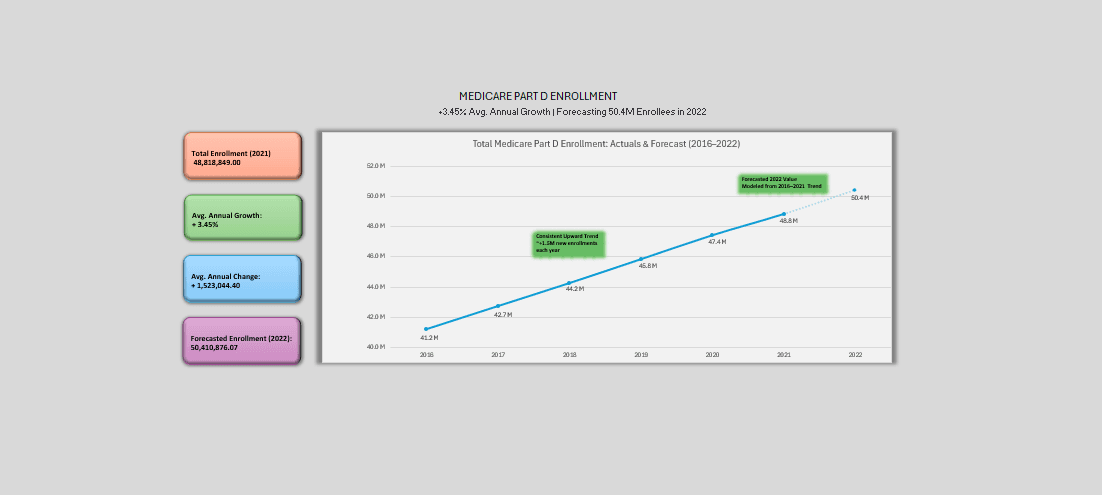
Built an Excel-based forecasting dashboard to analyze and predict Medicare Part D enrollment trends (2016–2022). Utilized Power Query for data cleaning and applied advanced Excel formulas to calculate year-over-year metrics and forecast future enrollment based on historical patterns.

Excel | Power Query
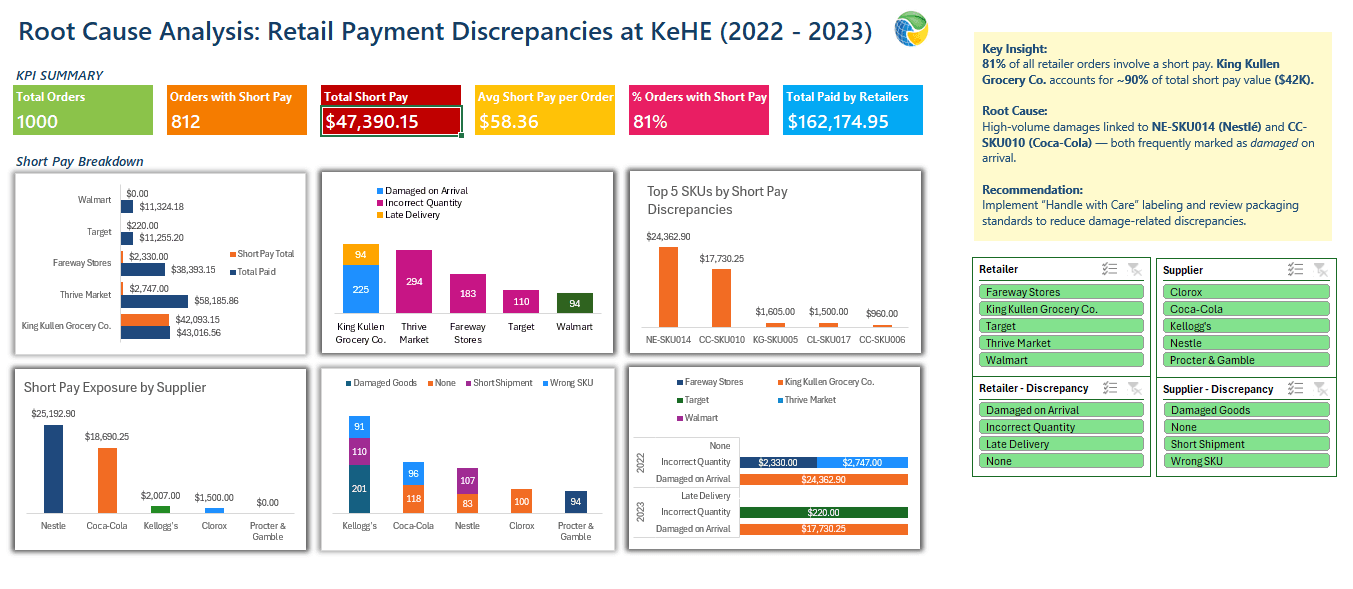
This dashboard tracks short pay discrepancies for KeHE, identifying root causes and high-risk retailers and suppliers. It highlights that 81% of orders had short pays, with King Kullen Grocery Co. driving most of the exposure (~$42K). The main issue was damaged goods, especially from Nestlé and Coca-Cola. Recommendations focus on improving packaging and labeling to reduce future short pays.

I'm a data analyst who builds dynamic dashboards, streamlines reporting workflows with Power Query and Excel VBA, and transforms messy data into clear, actionable insights. I specialize in leveraging tools like Power BI, SQL, Excel, and Python to help teams and clients make smarter, faster business decisions.